ggredist provides ggplot2 extensions for political mapmaking, including new geometries, easy label generation and placement, automatic map coloring, and map scales, palettes, and themes.
Here’s an example of what you can do with the package.
library(ggredist)
library(ggplot2)

data(oregon)

ggplot(oregon, aes(group=cd_2020)) +
  # 'ndv' and 'nrv' contain D and R vote counts
  geom_district(aes(fill=ndv, denom=ndv+nrv), linewidth=0.9) +
  geom_district_text() +
  # can then highlight towns and cities
  geom_places(state = 'OR') +
  # we can overlay county boundaries and labels
  geom_district(aes(group=county), linewidth=0.2, linetype="dashed", fill=NA) +
  geom_district_text(aes(group=county, label=toupper(county)),
                     size=2.2, check_overlap=TRUE) +
  scale_fill_party_b(limits=c(0.4, 0.6)) +
  theme_map()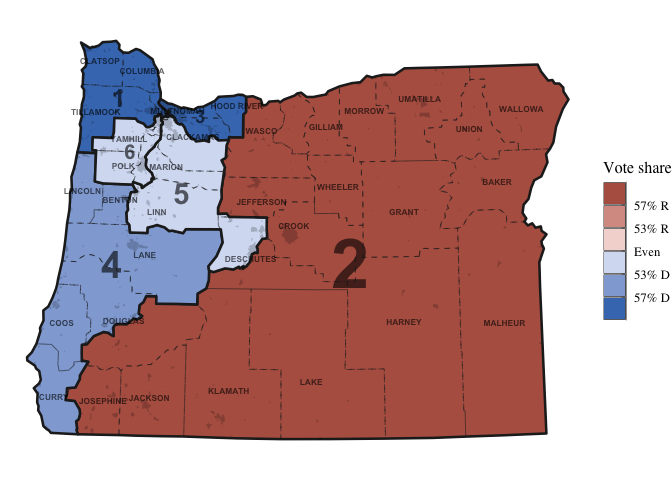
See more in the reference.
Installation
You can install the development version of ggredist from GitHub with:
# install.packages("remotes")
remotes::install_github("alarm-redist/ggredist")