Clips the interstates and cities datasets to the bounding box of the map and plots them.
Usage
stat_cities(
  mapping = NULL,
  data = NULL,
  geom = ggplot2::GeomSf,
  position = "identity",
  na.rm = FALSE,
  adjust = 1,
  min_pop = 1e+05,
  show.legend = NA,
  inherit.aes = TRUE,
  ...
)

stat_interstates(
  mapping = NULL,
  data = NULL,
  geom = ggplot2::GeomSf,
  position = "identity",
  na.rm = FALSE,
  show.legend = NA,
  inherit.aes = TRUE,
  ...
)
Arguments
- mapping
Set of aesthetic mappings created by
ggplot2::aes()- data
The data to be displayed in this layer
- geom
The geometric object to use display the data
- position
Position adjustment
- na.rm
if
TRUE, will silently remove missing values from calculations- adjust
A multiplicative scaling factor for the default label sizes
- min_pop
The minimum population a city must have had in 2006 to be shown.
- show.legend
Should this layer be included in the legends?
- inherit.aes
If
FALSE, overrides the default aesthetics, rather than combining with them.- ...
Passed onto the underlying geoms.
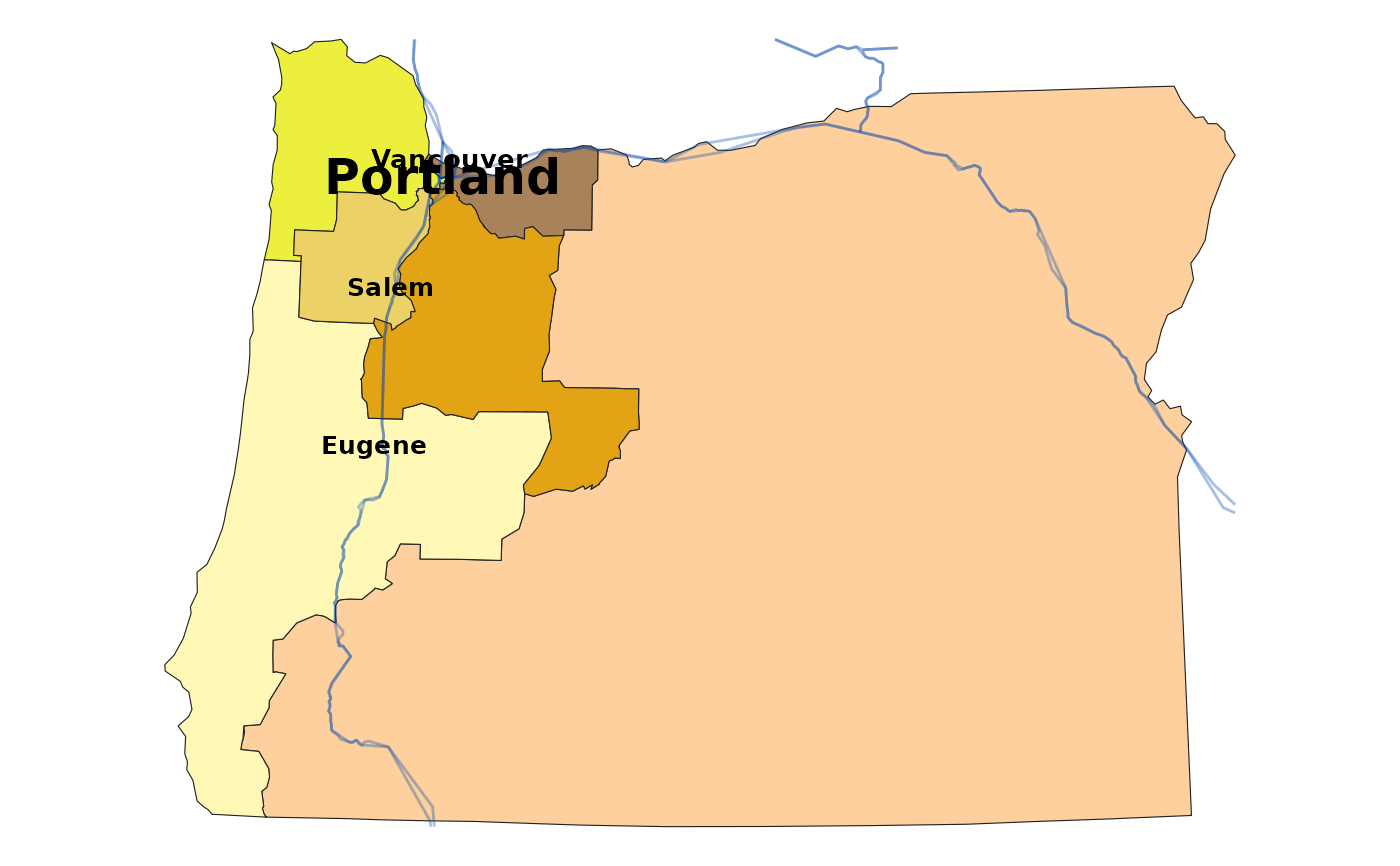
Examples
library(ggplot2)
data(oregon)

ggplot(oregon, aes(group=cd_2020)) +
  geom_district() +
  stat_interstates(size=1.4, color="#0044aa55") +
  stat_cities(geom="text", min_pop=130e3, fontface="bold", adjust=0.8) +
  scale_fill_penn82() +
  theme_map()