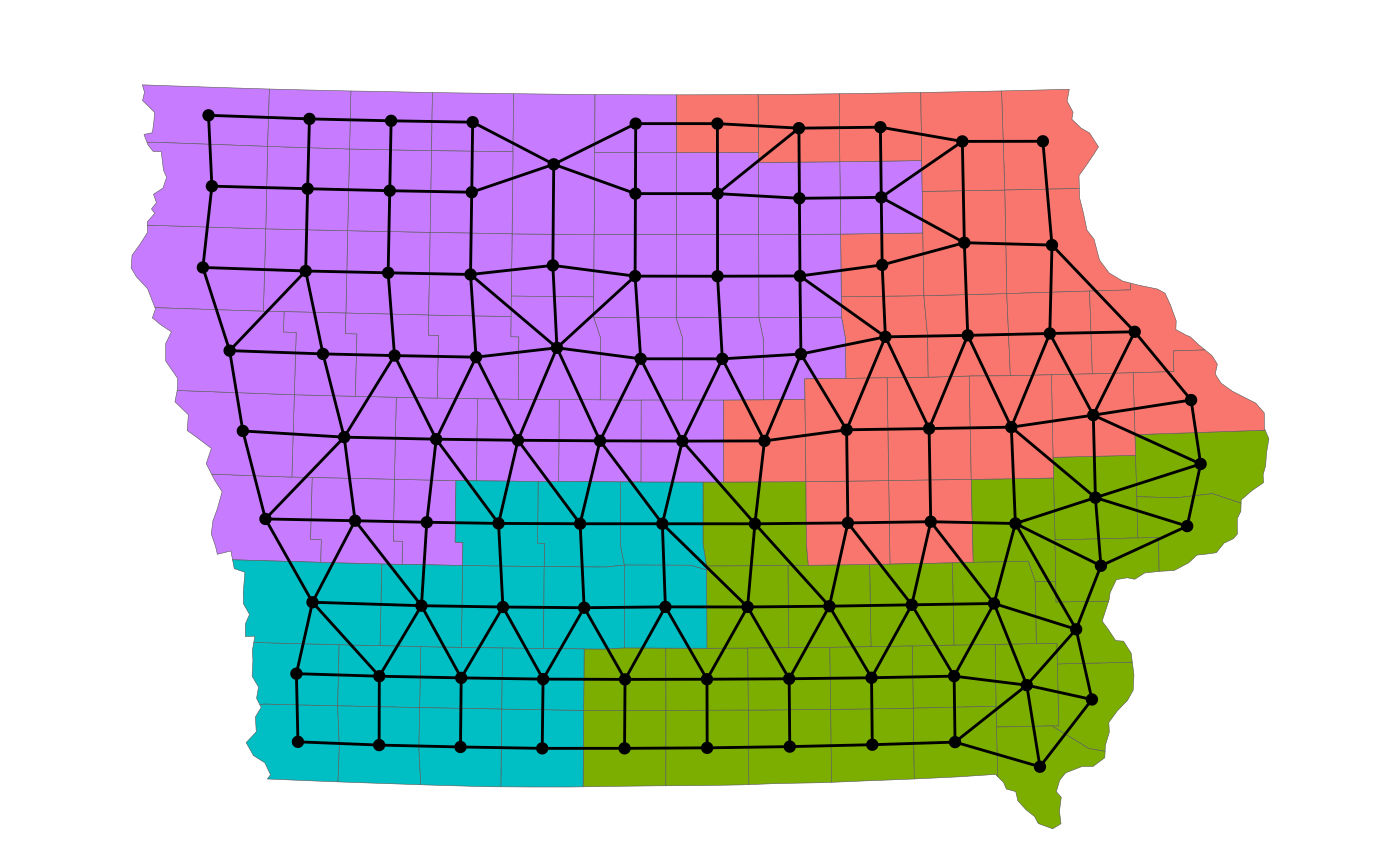
Creates a Graph Overlay
Usage
redist.plot.adj(
  shp,
  adj = NULL,
  plan = NULL,
  centroids = TRUE,
  drop = FALSE,
  plot_shp = TRUE,
  zoom_to = NULL,
  title = ""
)
Arguments
- shp
A SpatialPolygonsDataFrame or sf object. Required.
- adj
A zero-indexed adjacency list. Created with redist.adjacency if not supplied. Default is NULL.
- plan
A numeric vector with one entry for each precinct in shp. Used to remove edges that cross boundaries. Default is
NULL. Optional.- centroids
A logical indicating if centroids should be plotted. Default is
TRUE.- drop
A logical indicating if edges that cross districts should be dropped. Default is
FALSE.- plot_shp
A logical indicating if the shp should be plotted under the graph. Default is
TRUE.- zoom_to
<data-masking>An indexing vector of units to zoom the map to.- title
A string title of plot. Defaults to empty string. Optional.
Examples
data(iowa)
redist.plot.adj(shp = iowa, plan = iowa$cd_2010)