Plot a Projective Contrast with positive False Discovery Rate (pFDR) Control
Source:R/proj.R
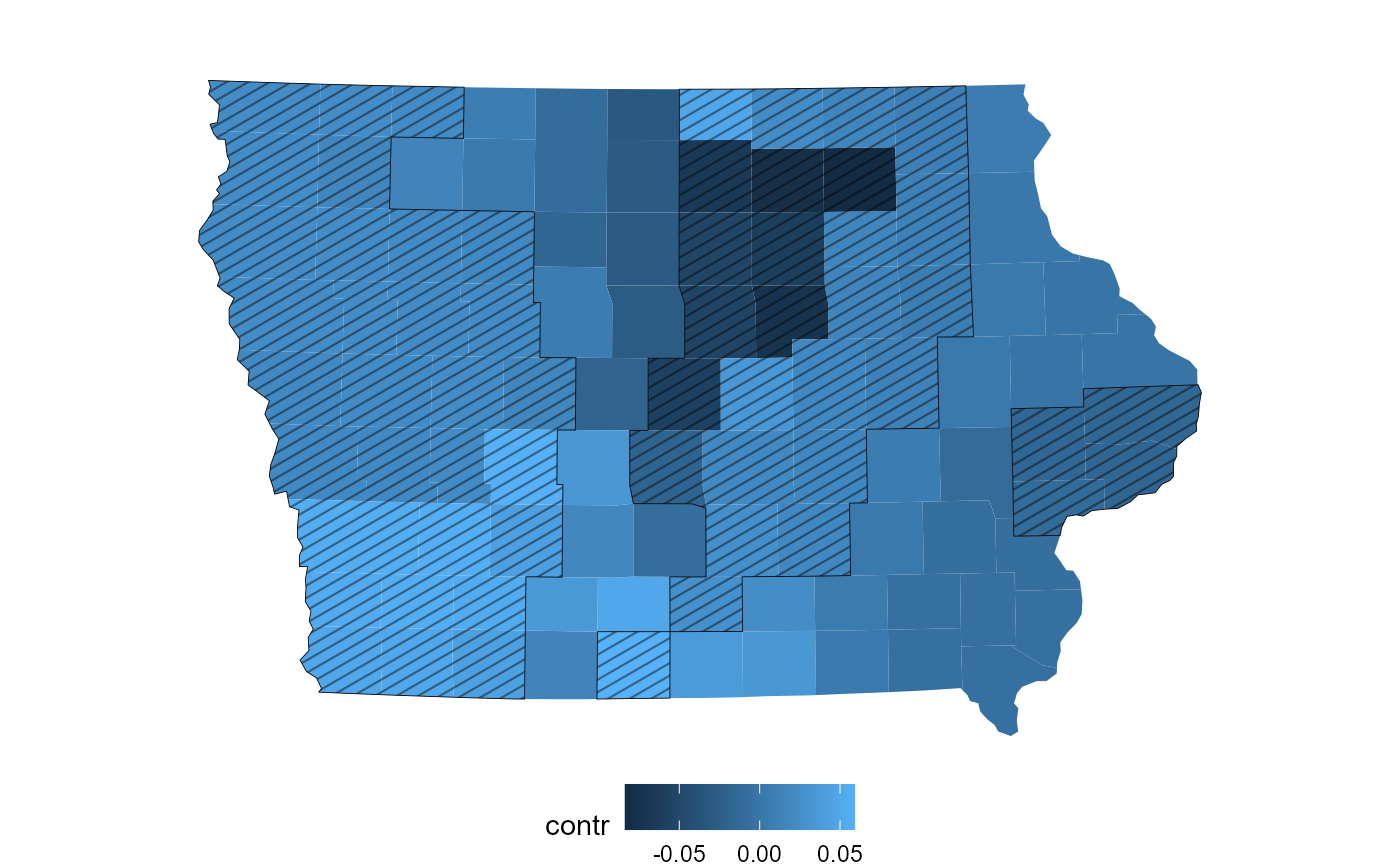
redist.plot.contr_pfdr.RdPlot a projective contrast on a map with areas selected by the pFDR control procedure hatched.
Arguments
- map
A redist_map object
- contr
The output of
proj_contr()withpfdr=TRUE: A vector containing the contrast and an attribute"q"containing the q-values.- level
The positive false discovery rate level to control.
- density
The density of the hatching (roughly what portion is shaded).
- spacing
The spacing of the hatches.
Examples
# example code
set.seed(1812)
data(iowa)
map <- redist_map(iowa, existing_plan = cd_2010, pop_tol = 0.01)
plans <- redist_smc(map, 50, silent = TRUE)
plans$dem <- group_frac(map, dem_08, tot_08, plans)

pc = proj_contr(plans, dem, pfdr=TRUE)
redist.plot.contr_pfdr(map, pc, level=0.4) # high `level` just to demonstrate