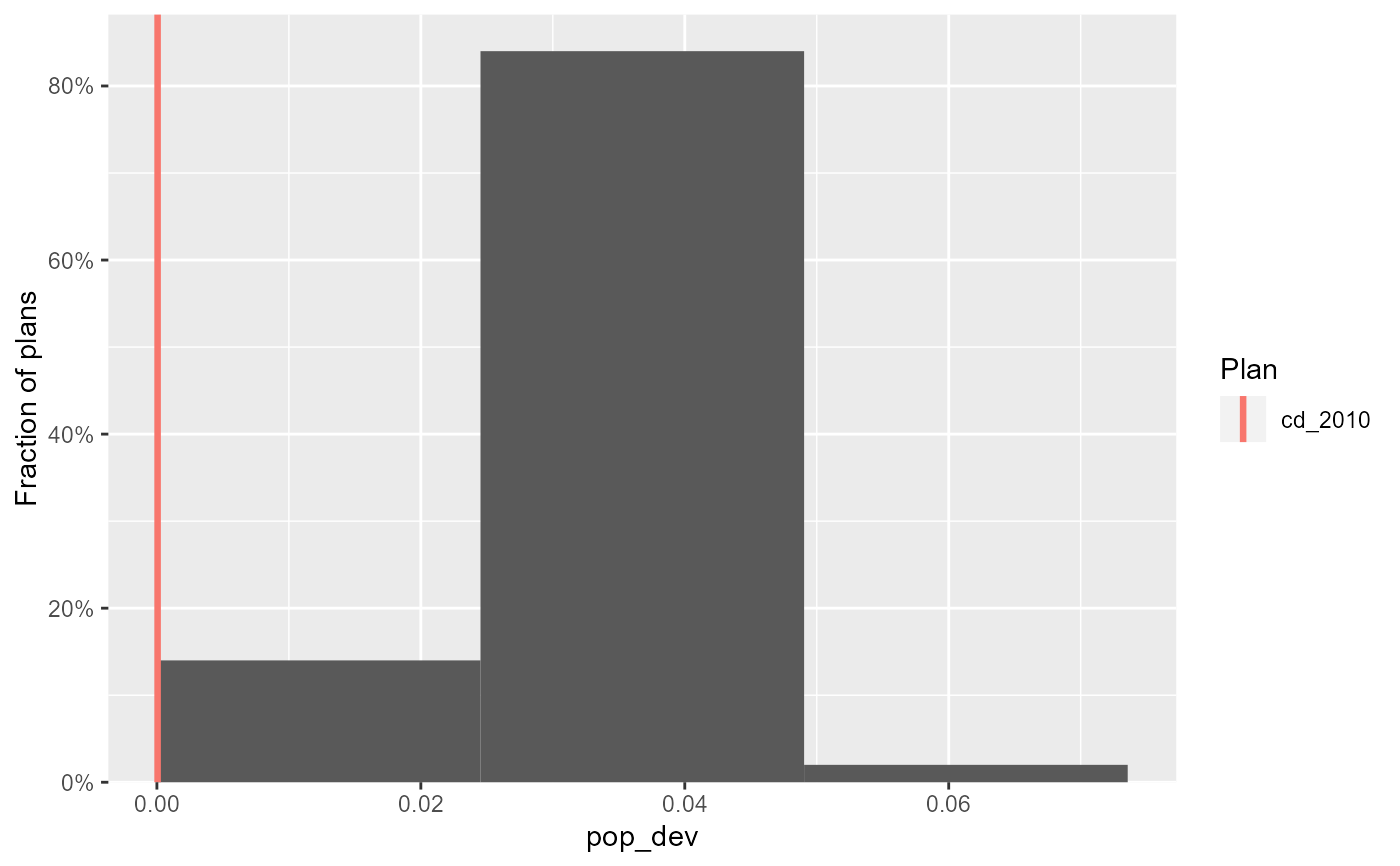
Plots a histogram of a statistic of a redist_plans object,
with a reference line for each reference plan, if applicable.
Usage
redist.plot.hist(plans, qty, bins = NULL, ...)

# S3 method for class 'redist_plans'
hist(x, qty, ...)
Arguments
- plans
the
redist_plansobject.- qty
<data-masking>the statistic.- bins
the number of bins to use in the histogram. Defaults to Freedman-Diaconis rule.
- ...
passed on to
geom_histogram- x
<data-masking>the statistic.