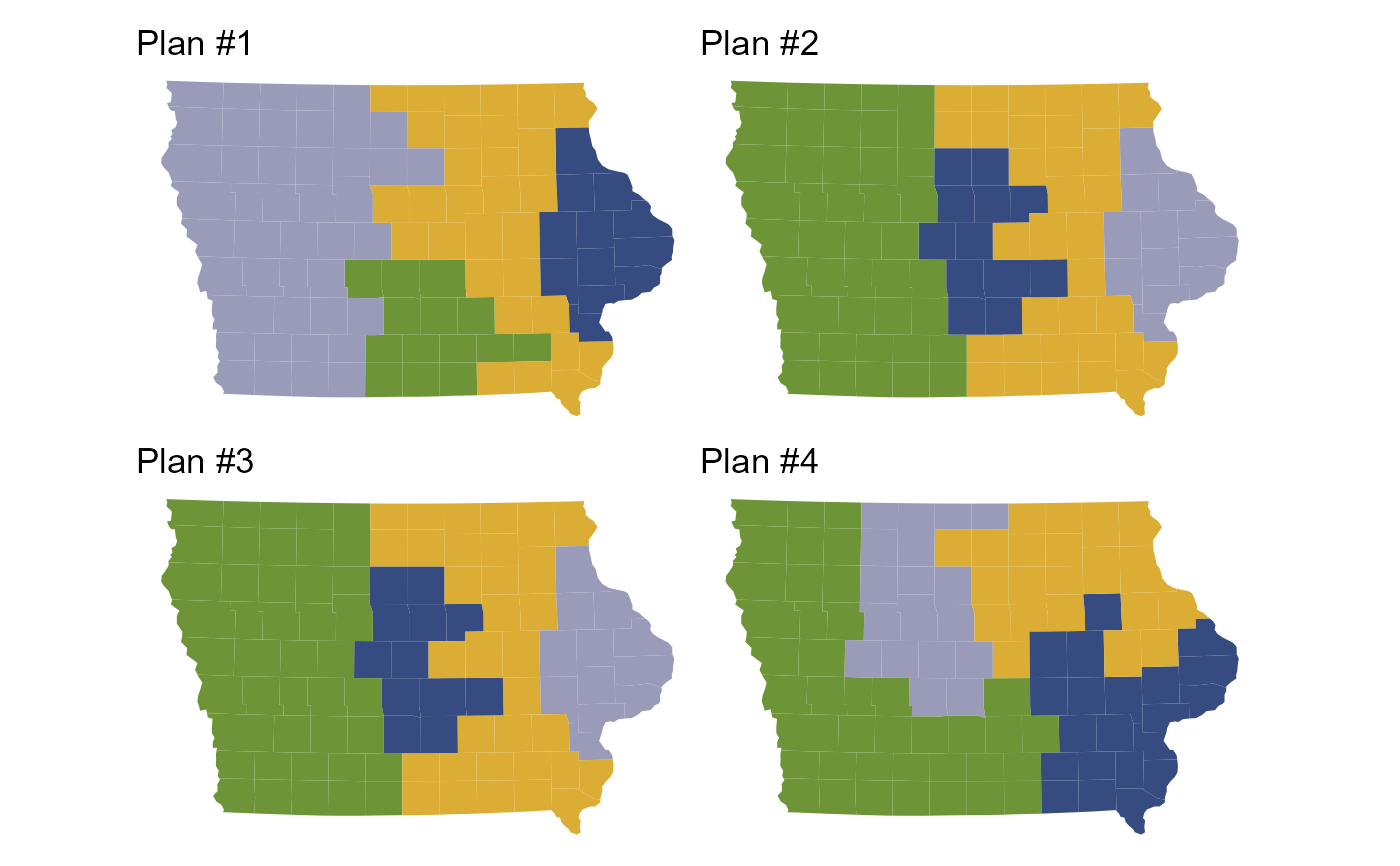
Plot a district assignment
Arguments
- plans
a
redist_plansobject.- draws
the plan(s) to plot. Will match the
drawcolumn ofx.- qty
the quantity to plot. Defaults to the district assignment.
- interactive
if
TRUE, show an interactive map in the viewer rather than a static map. Only uses the first element ofdraws- ...
additional arguments passed to the plotting functions.
- geom, shp
the
redist_mapgeometry to use (geomis deprecated).
Examples
library(dplyr)
data(iowa)

iowa <- redist_map(iowa, existing_plan = cd_2010, pop_tol = 0.05, total_pop = pop)
plans <- redist_smc(iowa, nsims = 100, silent = TRUE)
redist.plot.plans(plans, c(1, 2, 3, 4), iowa)