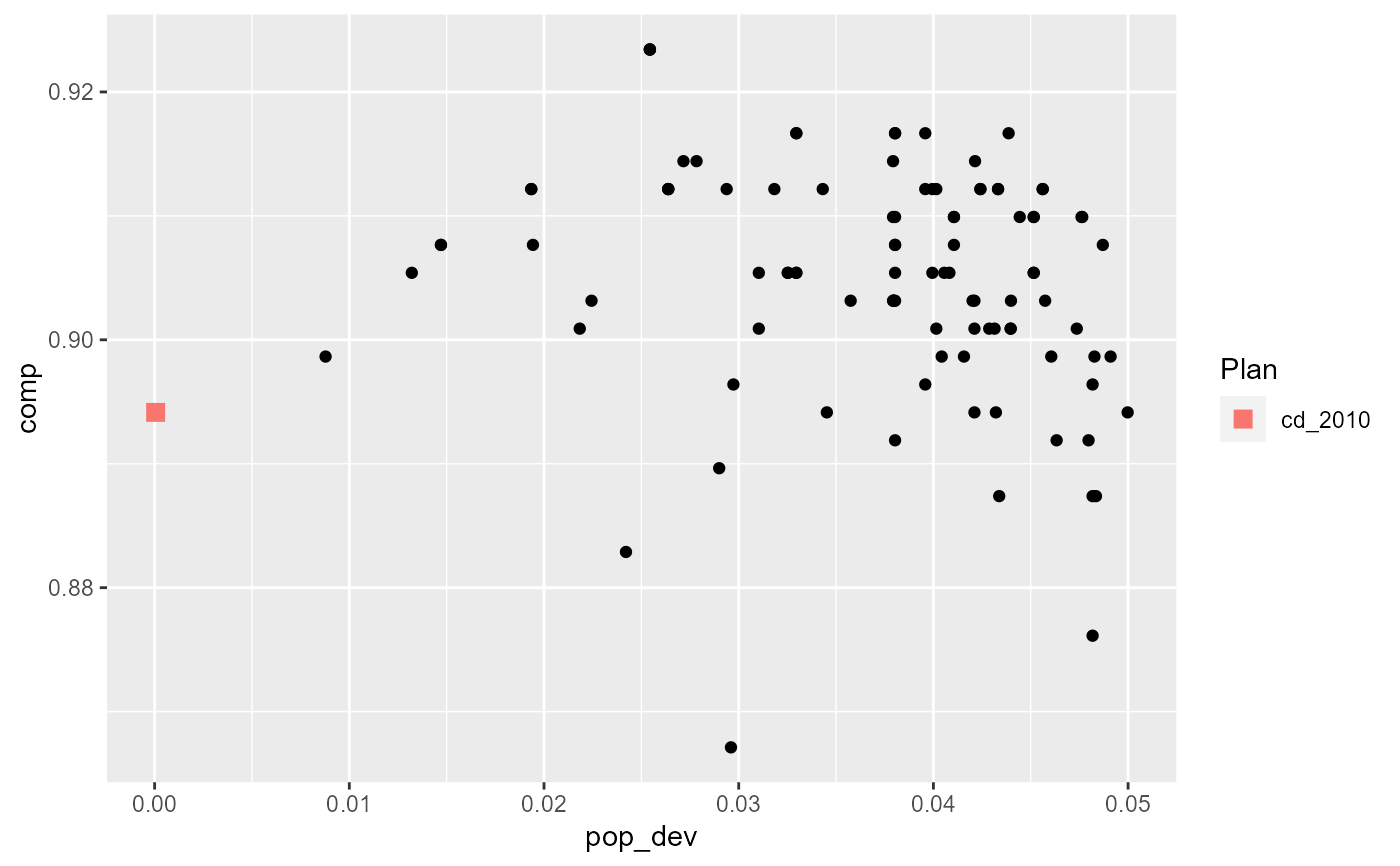
Makes a scatterplot of two quantities of interest across districts or plans.
Arguments
- plans
the
redist_plansobject.- x
<data-masking>the quantity to plot on the horizontal axis.- y
<data-masking>the quantity to plot on the vertical axis.- ...
passed on to
geom_point.- bigger
if TRUE, make the point corresponding to the reference plan larger.
Examples
library(dplyr)
data(iowa)

iowa <- redist_map(iowa, existing_plan = cd_2010, pop_tol = 0.05, total_pop = pop)
plans <- redist_smc(iowa, nsims = 100, silent = TRUE)
plans %>%
    mutate(comp = distr_compactness(iowa)) %>%
    group_by(draw) %>%
    summarize(pop_dev = max(abs(total_pop/mean(total_pop) - 1)),
        comp = comp[1]) %>%
    redist.plot.scatter(pop_dev, comp)
#> Warning: There were 2 warnings in `"draw" %in% names(data)`.
#> The first warning was:
#> ℹ In argument: `comp = distr_compactness(iowa)`.
#> Caused by warning in `distr_compactness()`:
#> ! 'distr_compactness' is deprecated.
#> See help("Deprecated")
#> ℹ Run `dplyr::last_dplyr_warnings()` to see the 1 remaining warning.