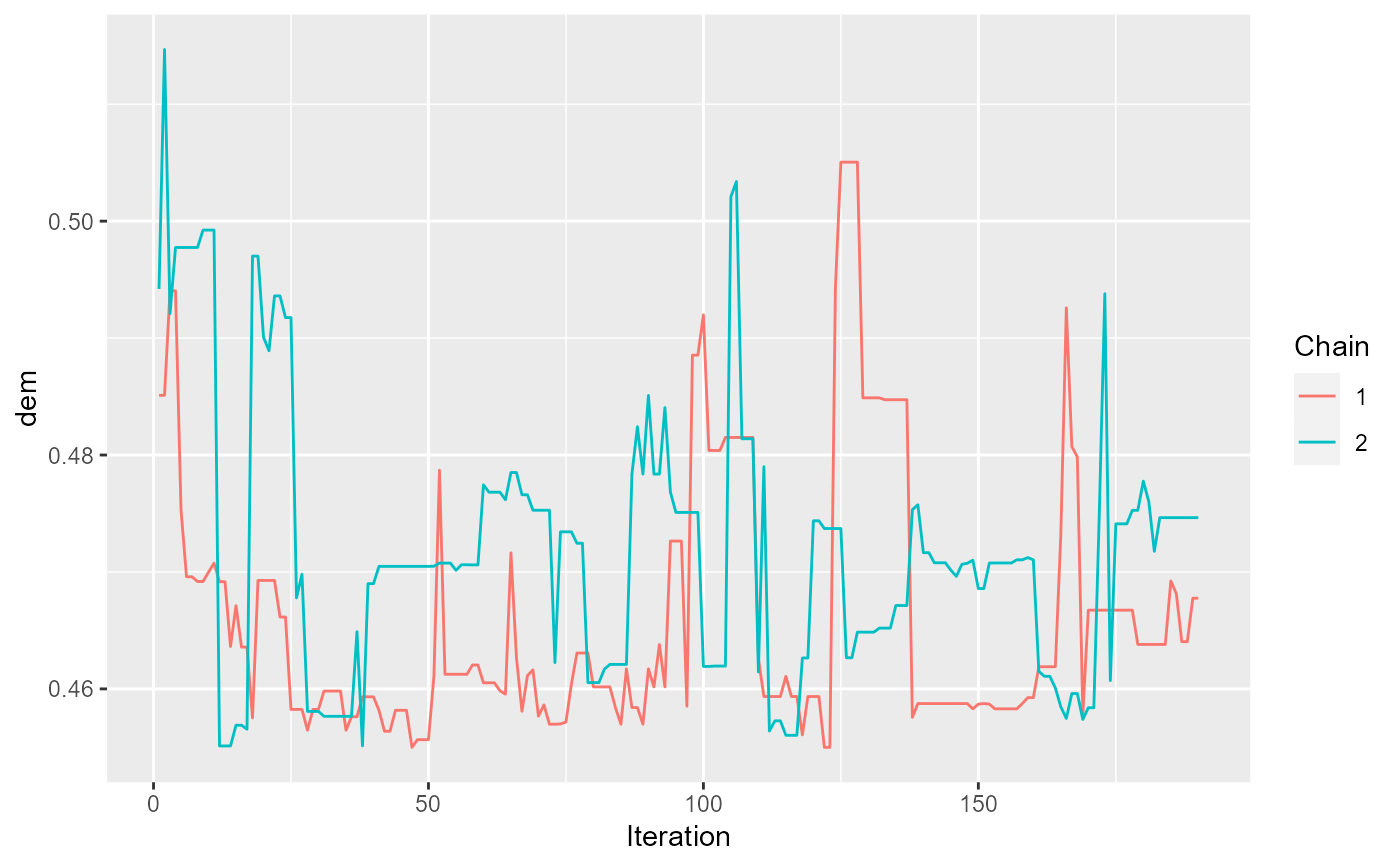
For a statistic in a redist_plans object,
make a traceplot showing the evolution of the statistic over MCMC iterations.
Arguments
- plans
the
redist_plansobject.- qty
<data-masking>the statistic.- district
for
redist_plansobjects with multiple districts, whichdistrictto subset to for plotting. Set toNULLto perform no subsetting.- ...
passed on to
geom_line
Examples
library(dplyr)
data(iowa)

iowa_map <- redist_map(iowa, existing_plan = cd_2010, pop_tol = 0.05)
plans <- redist_mergesplit_parallel(iowa_map, nsims = 200, chains = 2, silent = TRUE) %>%
    mutate(dem = group_frac(iowa_map, dem_08, dem_08 + rep_08)) %>%
    number_by(dem)
redist.plot.trace(plans, dem, district = 1)