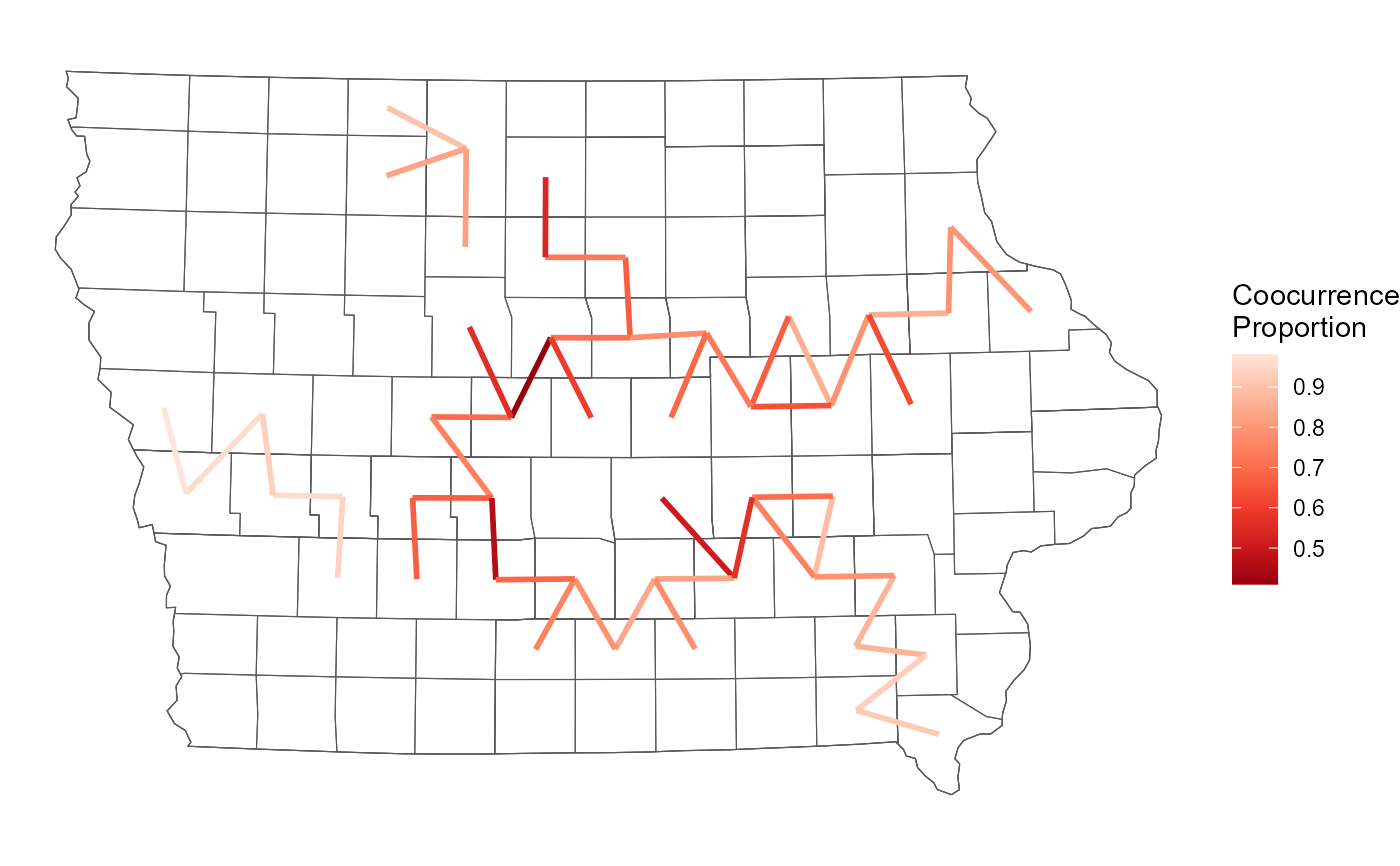
Plots the weighted adjacency graph by how often precincts coocur. If an argument to counties is provided, it subsets the edges to plot to those that cross over the county boundary.
Arguments
- shp
A SpatialPolygonsDataFrame, sf object, or redist_map. Required.
- plans
A
redist_plansobject or matrix of redistricting plans, where each column indicates a plan and each- counties
unquoted name of a column in
shpor a vector of county assignments. Subsets to edges which cross this boundary if supplied.- ref
Plot reference map? Defaults to TRUE which gets the existing plan from
- adj
A zero-indexed adjacency list. Extracted from
shpifshpis aredist_map. Otherwise created with redist.adjacency if not supplied. Default is NULL.- plot_shp
Should the shapes be plotted? Default is TRUE.
Examples
data(iowa)
shp <- redist_map(iowa, existing_plan = cd_2010, pop_tol = 0.01)
plans <- redist_smc(shp, 100)
#> SEQUENTIAL MONTE CARLO
#> Sampling 100 99-unit maps with 4 districts and population between 753973 and 769205.
#> Split [0/3] ■                                | ETA?
#> Split [3/3] ■■■■■■■■■■■■■■■■■■■■■■■■■■■■■■■  | ETA 0s
#>
redist.plot.wted.adj(shp, plans = plans, counties = region)
#> Warning: Use of `nb$wt` is discouraged.
#> ℹ Use `wt` instead.